

Cause 01 · All year
Vehicles: the steady, all-day source
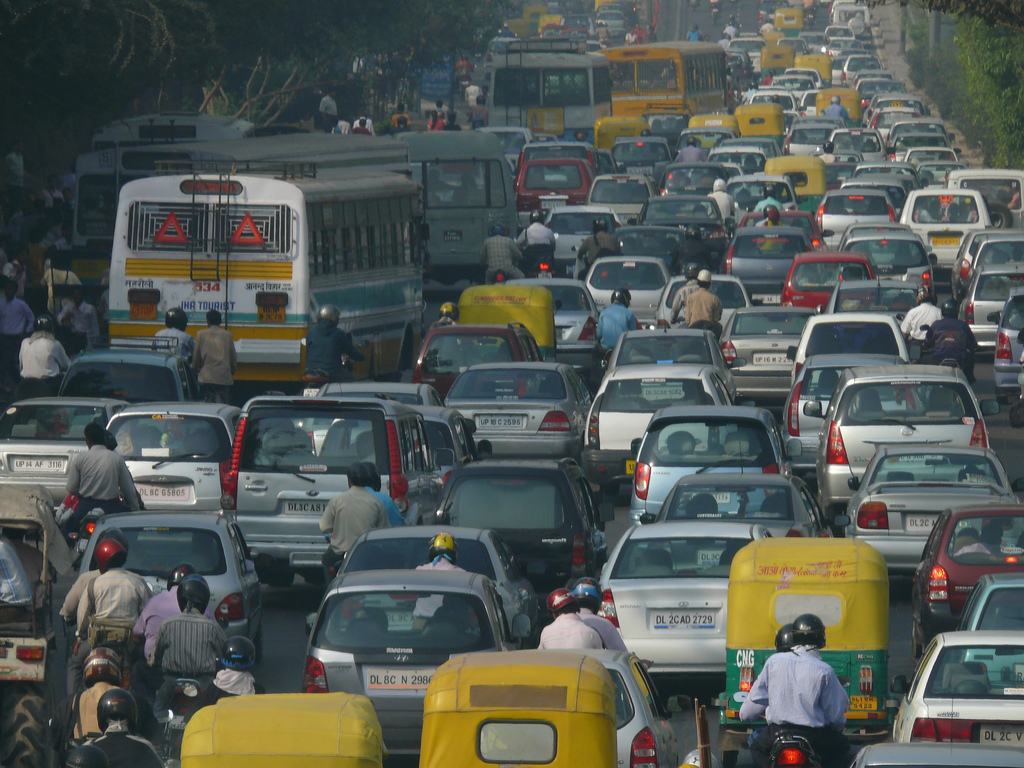
Direct answer: vehicles are the largest local source of Delhi's pollution that is present every day of the year. They release fine particles (PM2.5), nitrogen oxides (NOx) and carbon monoxide (CO). NOx also forms secondary particles later.
At a glance
- Transport gave about 28% of Delhi's winter PM2.5 in the TERI–ARAI source study.36
- Counting only Delhi's own (local) sources, vehicles gave more than half of PM2.5 in autumn 2024.52
- About 16,900 heavy trucks enter Delhi every day and produce 23% of the city's transport emissions.59
- Our satellite analysis: NO₂ over central Delhi was 1.71 times the level of the countryside.1
How vehicles pollute
Engines release PM2.5, NOx and CO straight from the exhaust, and diesel engines release the most soot. Tyres, brakes and wheels also throw road dust back into the air (see cause 03). NOx then reacts in the air to form nitrate particles, part of the "secondary" pollution explained in cause 02. Because exhaust comes out at street level, people on roads and in roadside homes breathe it before it can spread.
What research says
Different studies give different shares, because they use different methods, seasons and areas.
- TERI–ARAI (2018): transport gave about 28% of Delhi's PM2.5 in winter. The same study found that only 36% of Delhi's winter PM2.5 came from Delhi's own emissions; the rest came from outside.36
- CSE analysis of the IITM forecasting system (2024): among local sources only, vehicles gave more than half of Delhi's PM2.5 in October 2024.52
- Real-time study for the Delhi Pollution Control Committee (2023): vehicles were about 17% of winter PM2.5 on average, behind secondary particles and biomass burning.30
- Freight: a 2026 study by APAG, IIT Delhi and TERI found that heavy trucks entering Delhi give 23% of transport emissions.59
Reading these numbers: a source can be a small share of all PM2.5 but the largest share of what Delhi itself emits. Both are true for vehicles, so cleaning them up is something Delhi can do on its own.
What our data shows
Show the numbers
| Area | NO₂ (µmol/m²) |
|---|---|
| Central Delhi | 85.9 |
| Countryside | 50.4 |
Sentinel-5P shows a clear NO₂ dome over Delhi, 1.71 times the level of the surrounding countryside. In the CAMS model, NO₂ over Delhi peaks around 8–9 am and again from 6 to 9 pm, matching office traffic.1,3,9 Across 63 ground monitors, average PM2.5 for 1–10 November was 207 µg/m³, about 3.5 times India's 24-hour limit of 60.10
One result needs care. At the satellite's 1:30 pm pass, NO₂ follows industrial areas more than major-road length (industry ρ = 0.35 with roads held constant; roads ρ = −0.14, not significant). Mid-day traffic is lighter, and the satellite cannot see the rush hours. So this does not mean roads do not matter; it means the afternoon picture is shaped more by industry.
What is being done
About 5,238 of Delhi's 6,988 public buses were electric in October 2026.75 EVs made up 12.7% of new vehicles registered in Delhi in 2025-26.60 Freight remains the weak spot. See Solutions for what has worked and what to do next.
Limits of this data
The CAMS model has a native grid of about 40 km. Satellite NO₂ is a column through the whole air, measured once a day at about 1:30 pm, so it misses the morning and evening rush.