

Cause 10 · October–February
Weather and geography: the multiplier
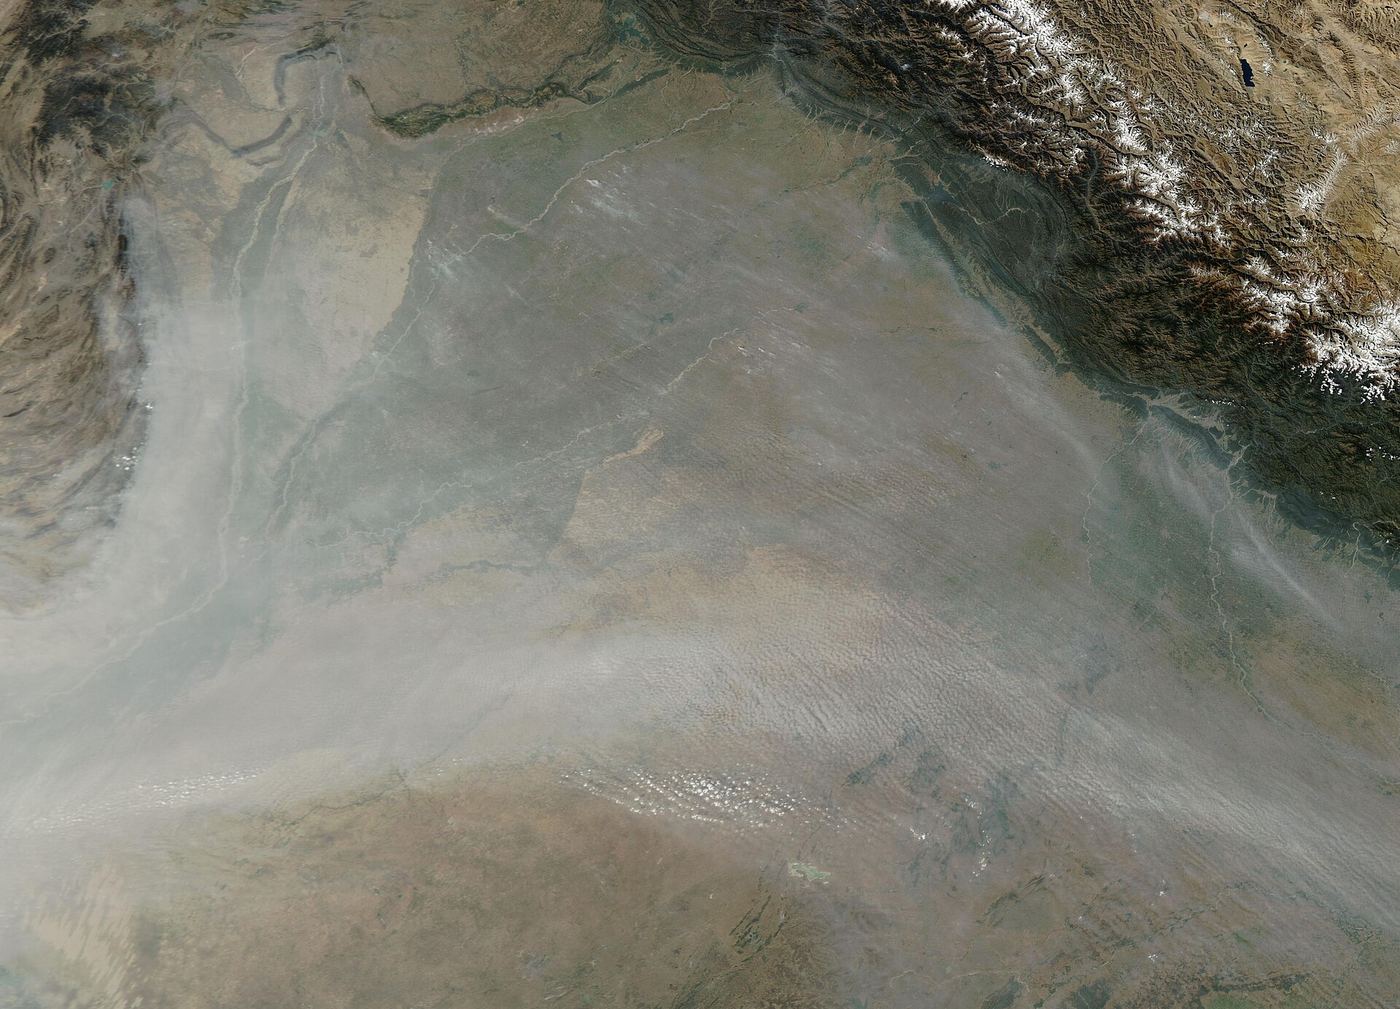
Direct answer: in winter, cold air near the ground gets trapped under warmer air (an inversion). Winds are weak. The Himalayas block air from moving north. So all pollution stays in a thin layer over Delhi.
At a glance
- Forecasters treat a ventilation index below 6,000 m²/s as poor for spreading pollution.38
- Winter morning mixing heights over Delhi are often only 40–80 m, so the city's smoke is held in a very thin layer.38
- Our analysis: 9 of 10 days in 1–10 November 2026 were below 6,000 m²/s, and Diwali was the worst at 1,137.1,9
- Our 3-D air paths: 71% came from the north-west, the direction of the Punjab crop fires.1
How weather traps pollution
On clear winter nights the ground cools fast, and the air touching it becomes colder than the air above. This upside-down layer, an inversion, acts like a lid. The "mixing height", the depth of air that pollution can spread into, falls to a few tens of metres at night and rises only partly in the afternoon. Winds are light, so little air moves through the city. The Himalayas to the north and the Aravallis to the south-west shape the flow along the plain, and the same air mass slowly carries pollution down the Indo-Gangetic Plain.
The ventilation index combines both effects: it is the daily maximum mixing height multiplied by the wind speed in that layer. The lower it is, the less room pollution has to spread out.38
What our data shows
Show the numbers
| Date (Nov) | Ventilation index (m²/s) |
|---|---|
| 1 | 4,452 |
| 2 | 4,568 |
| 3 | 7,124 |
| 4 | 4,569 |
| 5 | 3,076 |
| 6 | 5,336 |
| 7 | 4,331 |
| 8 | 1,137 |
| 9 | 3,240 |
| 10 | 4,155 |
From 1 to 10 November the ventilation index ranged from 1,137 (Diwali) to 7,124 m²/s (3 November), and 9 of 10 days were below 6,000. In May the monthly average was about 15,200; in November about 4,200.1,9
How much does weather matter? We fitted two simple regressions to the hourly average PM2.5 of 63 monitors (R² 0.31–0.49) and checked them with a day-by-day bootstrap. The clearest result: when the mixing height halves, PM2.5 rises about 7–13% in both models. Each extra 1,000 fires in Delhi's air path went with about 20% more PM2.5, but this result is uncertain. Stronger wind went with more PM2.5 (+17% per m/s): in these days, stronger wind mostly meant north-west wind carrying smoke from Punjab. Hours are not independent and the period is short, so treat these as rough sizes.
10What can be done
Weather cannot be changed, but it can be forecast. Since 2024, GRAP steps can start up to three days early based on the IMD/IITM forecast.32 Cutting emissions before a low-ventilation spell is the most useful response; see Solutions.
Limits of this data
Mixing height and wind come from the Open-Meteo weather model, not from balloon soundings. The 6,000 m²/s line is a forecasting rule of thumb, not a physical limit.