

Cause 04 · All year
Industry, brick kilns and dirty fuels
Direct answer: factories and brick kilns in and around Delhi burn coal, pet coke, furnace oil and biomass. They release particles, SO₂ and CO. Brick kilns are among the biggest sources in the Indo-Gangetic Plain, the "brick belt" of India.
At a glance
- Coal and other unapproved fuels have been banned for industry across Delhi-NCR since 1 January 2023.56
- Pet coke can carry up to 74,000 ppm of sulphur. It was banned in Delhi in 1996 and in the NCR parts of Haryana, Rajasthan and Uttar Pradesh from November 2017.20
- Only 58 of 142 industrial units checked by CSE (40.8%) had emission-monitoring data that the public could download.74
- Our kiln map: 3,014 brick kilns stand within 100 km of Delhi.1,13
How industry pollutes
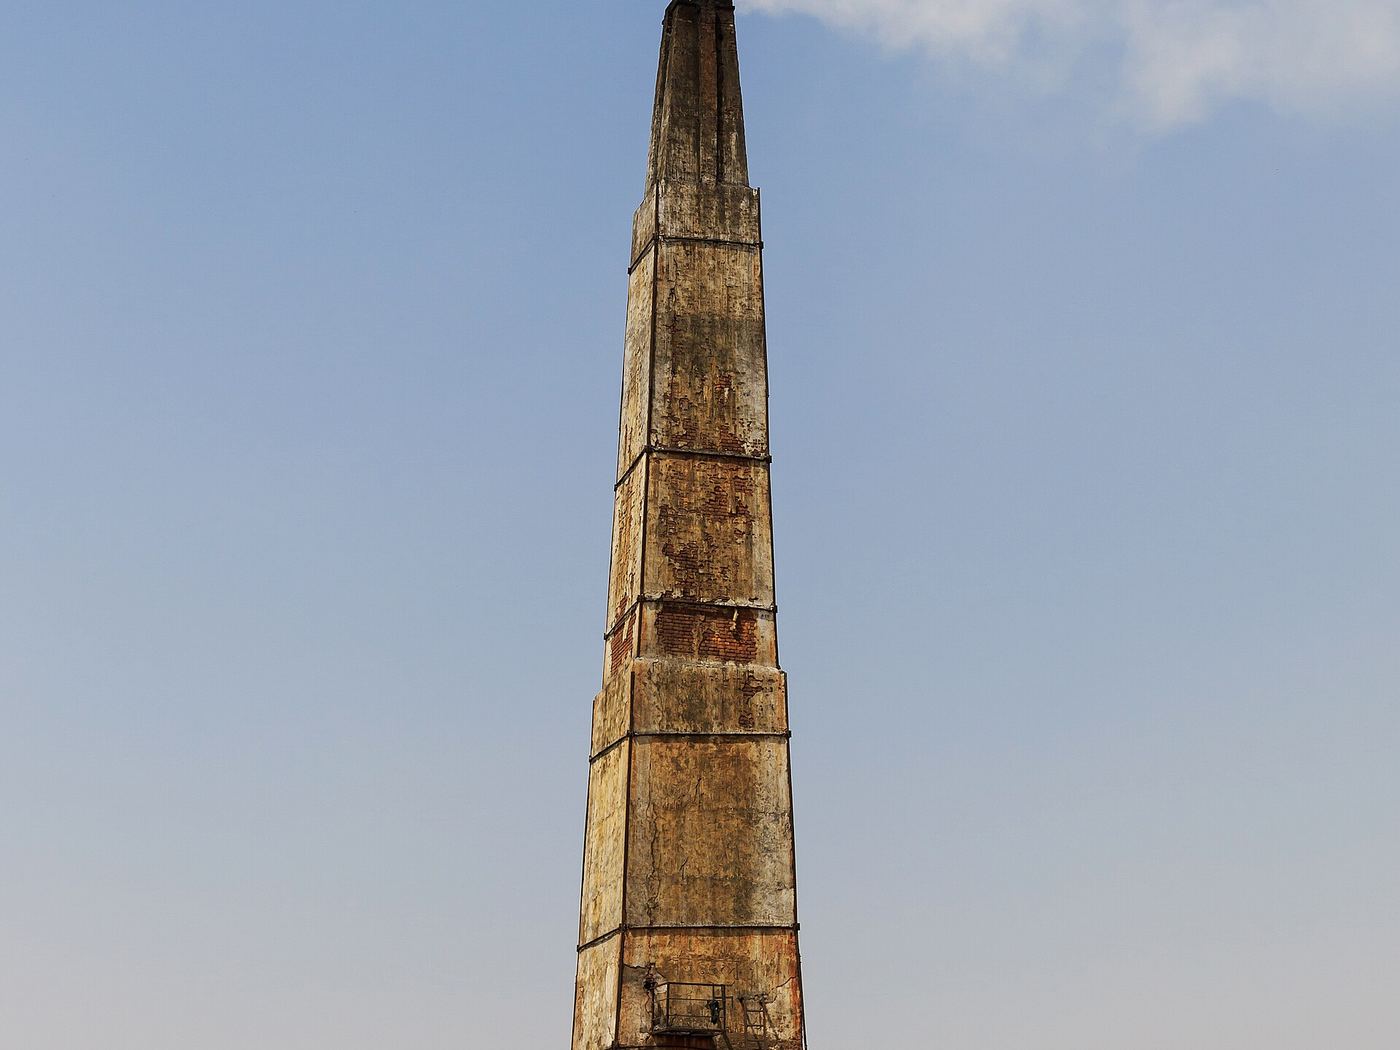
Boilers, furnaces and kilns that burn solid or heavy fuels release fine particles, SO₂, NOx and CO. Stone crushers and mines add dust. Brick kilns burn coal, wood and farm waste for weeks at a time, and the older fixed-chimney design burns them less completely than the newer zigzag design.29 Sulphur in the fuel becomes SO₂, which later forms sulphate particles (see cause 02).
What research says
- TERI–ARAI (2018): industry gave about 22–30% of Delhi's PM2.5, depending on the season and method. In winter, brick kilns made up a notable part of that industrial share.34
- Brick kilns: kilns are estimated to contribute 8–14% of air pollution in the Indo-Gangetic Plain.46
- Cleaner kilns: a 2026 comparison of stack emissions found zigzag kilns gave the largest cuts, especially when part of the coal was replaced with farm residue.29
- Monitoring gap: CSE found emission data for NCR industry is scattered across portals, and most units it checked had no downloadable data for 10–20 November 2025.74
Guttikunda and colleagues reviewed Delhi’s air quality and source-apportionment studies from 1990 to 2022. Their review puts road transport and brick kilns in historical context. The Atlas’s November 2026 maps show spatial associations. A separate analysis would be needed to estimate the share of ground-level PM₂.₅ from each sector during the episode.39
What our data shows
Satellite NO₂ is higher over industrial areas, even after removing the effect of road length (ρ = 0.35, p < 0.001). In the model, industrial cells also show more CO after removing traffic (ρ = 0.28, p = 0.001).1,3,11
Show the numbers
| District | Kilns |
|---|---|
| Baghpat | 416 |
| Jhajjar | 297 |
| Bulandshahr | 273 |
| Ghaziabad | 219 |
| Meerut | 197 |
The brick kiln map comes from SentinelKilnDB, a hand-checked dataset built from Sentinel-2 images (Nov 2023–Feb 2024).13 Of all kilns in the map area, 7,296 are cleaner zigzag kilns and 6,154 are older fixed-chimney (FCBK) kilns, which smoke more.
Show the numbers
| Kiln type | Number |
|---|---|
| Zigzag | 7,296 |
| Fixed chimney | 6,154 |
What is being done
The NCR coal ban forced many units to move to gas, but industries say gas costs more and some waited long for a connection.51,56 See Solutions for what we recommend next.
Limits of this data
OSM shows where industrial land is, not factory size or fuel. Kiln positions can be off by up to ~0.6 km, and kilns built or closed after early 2024 are not included.