

Research report · Seasons
Why winter is worst, and summer is dusty
Delhi has two kinds of bad air. Winter brings trapped smoke and fine particles; late spring and summer bring dust. This page explains the year month by month.
Key findings
- In our model data for 2026, PM2.5 was highest in January (121 µg/m³) and lowest in September (52 µg/m³), after the monsoon rain.1,9
- PM10 peaked in May (486 µg/m³), when about three-quarters of it was coarse dust.1
- The air spreads pollution out much better in summer: the ventilation index in May was about 5.5 times January's.1
- Winter smog does not end with the crop-fire season. In December 2025, after the fires had ended, smog was more intense than in October and November.19
1. The pollution calendar
| Season | Months | What drives the pollution | Our model data |
|---|---|---|---|
| Winter | Dec–Feb | Cold, still air traps smoke near the ground (cause 10). Secondary particles, vehicle exhaust and home fires add up (02, 01, 07). | January PM2.5 121, ventilation 2,754 m²/s |
| Spring and summer | Mar–Jun | Hot, dry winds and dust storms; deep mixing spreads smoke out but lifts dust (cause 03). | May PM10 486, 76% coarse dust; ventilation 15,209 m²/s |
| Monsoon | Jul–Sep | Rain washes particles out of the air; the cleanest months. | September PM2.5 52; July rain 263 mm |
| Post-monsoon | Oct–Nov | Ventilation falls, crop fires peak and Diwali adds a spike (06, 09). | 1–10 Nov PM2.5 115, ventilation 4,199 m²/s |
2. Fine particles: a winter problem
Show the numbers
| Month (2026) | Monthly average PM2.5 in central Delhi, 2026 |
|---|---|
| Jan | 121 |
| Feb | 81 |
| Mar | 76 |
| Apr | 73 |
| May | 103 |
| Jun | 102 |
| Jul | 72 |
| Aug | 65 |
| Sep | 52 |
| Oct | 75 |
| Nov* | 115 |
PM2.5 is mostly smoke, exhaust and particles formed in the air. It rises from October, peaks from December to January, and falls through spring. The post-monsoon months combine three things at once: falling ventilation, crop fires in Punjab and Haryana, and Diwali.1
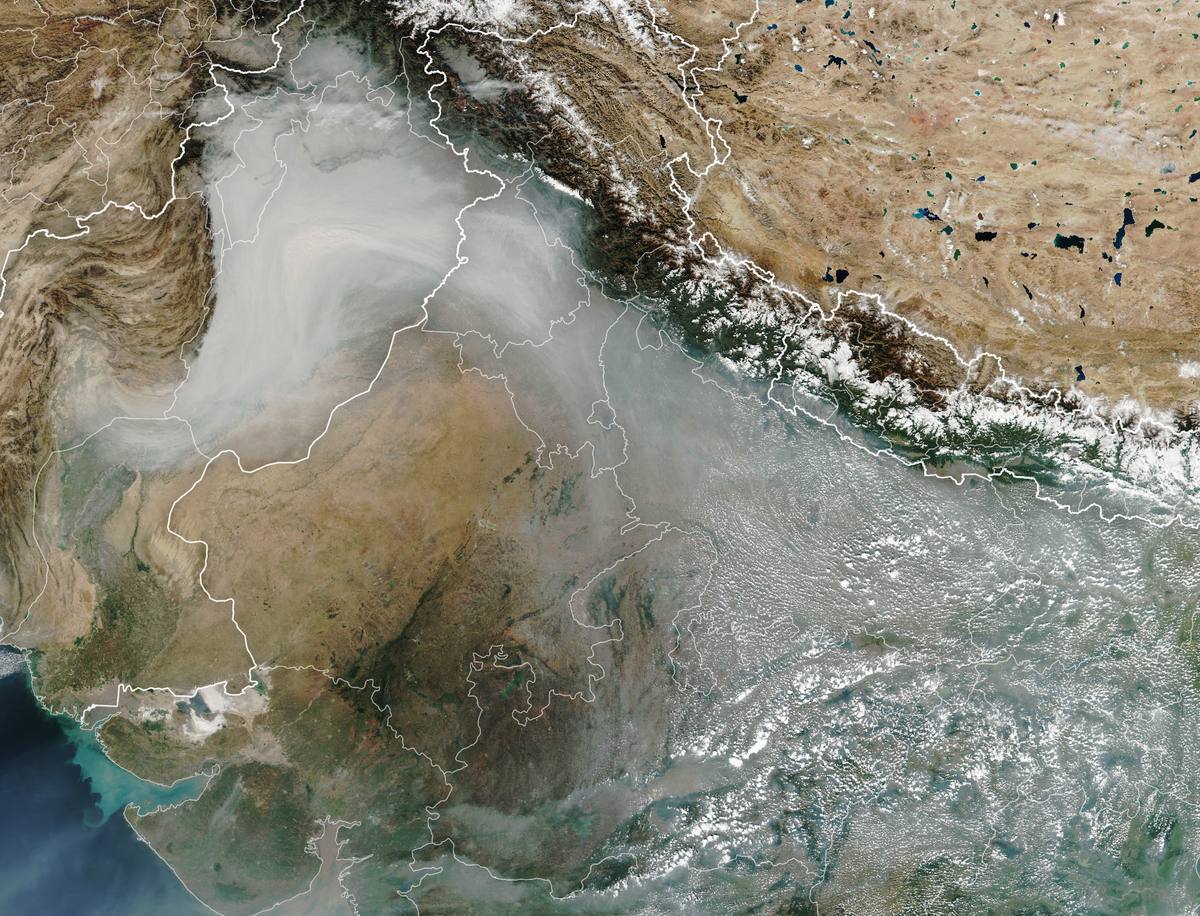
Crop fires are only part of the story. CSE found that Delhi's smog in December 2025 was more intense and widespread than in October and November, even though stubble burning had ended.19 Its share of Delhi's PM2.5 averaged 4.9% between mid-October and November 2025.55 Winter pollution is mainly the region's everyday emissions, trapped by the weather.
3. Dust: a summer problem
Show the numbers
| Month (2026) | Monthly average PM10 in central Delhi, 2026 |
|---|---|
| Jan | 125 |
| Feb | 105 |
| Mar | 317 |
| Apr | 401 |
| May | 486 |
| Jun | 406 |
| Jul | 212 |
| Aug | 132 |
| Sep | 93 |
| Oct | 190 |
| Nov* | 187 |
PM10, which includes coarse dust, behaves very differently. It peaks from April to June, when about three-quarters of it is coarse dust in our model data. In January coarse dust is only about 4% of PM10. Summer air mixes several kilometres high, so smoke spreads out, but dry winds and dust storms keep PM10 high.1,9
4. Why the weather matters
Show the numbers
| Month (2026) | Monthly average ventilation index over Delhi, 2026 |
|---|---|
| Jan | 2,754 |
| Feb | 5,717 |
| Mar | 8,758 |
| Apr | 14,345 |
| May | 15,209 |
| Jun | 8,413 |
| Jul | 4,688 |
| Aug | 3,230 |
| Sep | 4,846 |
| Oct | 4,998 |
| Nov* | 4,199 |
The ventilation index measures how well the air can spread pollution: the daily maximum mixing height multiplied by the wind speed in that layer. Below about 6,000 m²/s, forecasters treat conditions as poor for dispersion.38 In our data the index was above that line from March to June and below it from July to February, with the lowest value in January.1,9
Show the numbers
| Month (2026) | Monthly rainfall over Delhi, 2026 |
|---|---|
| Jan | 46 |
| Feb | 14 |
| Mar | 24 |
| Apr | 17 |
| May | 27 |
| Jun | 30 |
| Jul | 263 |
| Aug | 248 |
| Sep | 114 |
| Oct | 124 |
| Nov* | 0 |
Rain is the other cleaner. Monsoon rain from July to September washes particles out, which is why September has the lowest PM2.5 of the year even though ventilation is low.1,9
What this means: the same emissions give very different air in different seasons. Winter needs extra cuts in smoke and gases before still-air spells (see Solutions); summer needs dust control on roads and building sites.
PM2.5, PM10, ventilation and rain are CAMS model and Open-Meteo weather values for central Delhi (µg/m³, m²/s, mm). The model reads lower than ground monitors (see Method), so use these for the shape of the year, not exact levels.