

Cause 06 · October–November
Crop stubble burning
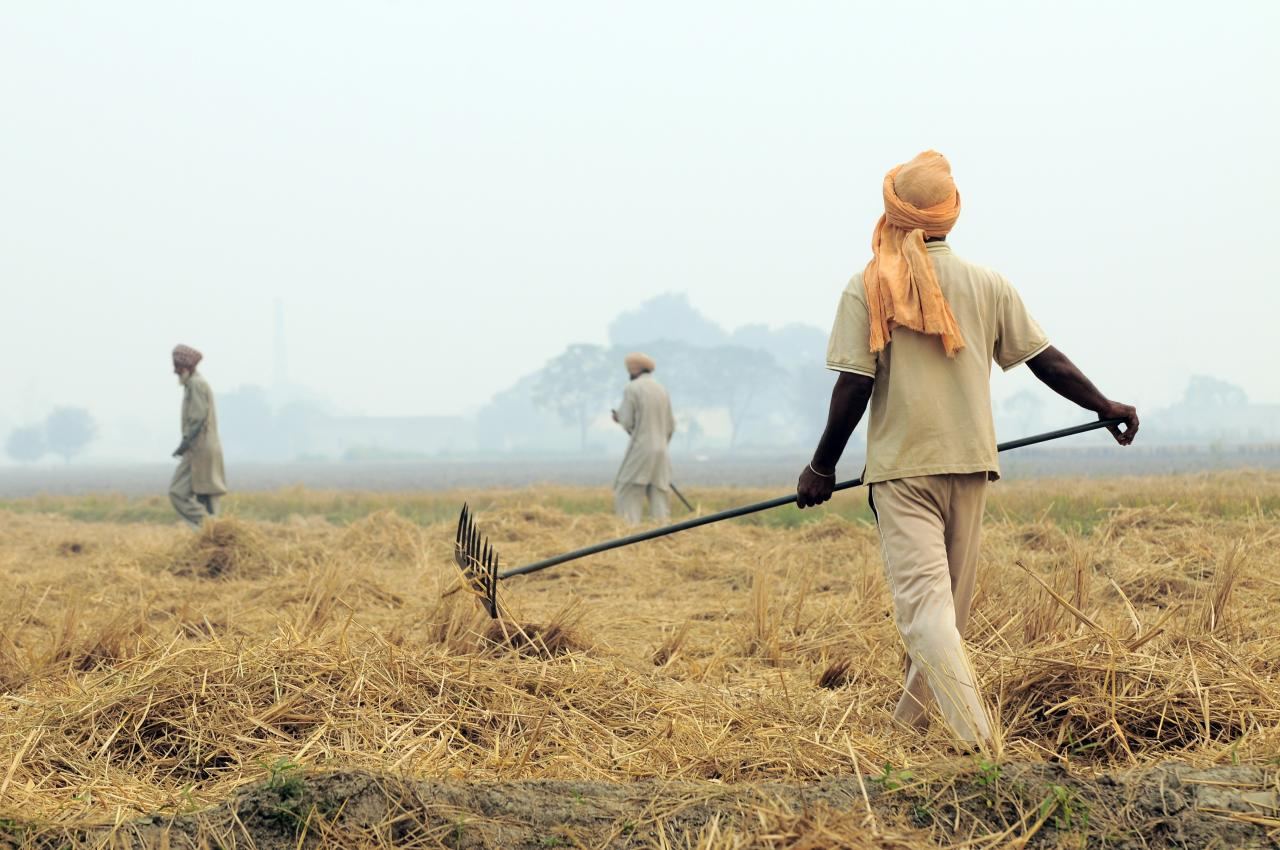
Direct answer: farmers in Punjab, Haryana and Pakistan's Punjab burn paddy straw in October and November. North-west winds carry the smoke to Delhi. It causes big spikes for a few weeks but is not the main year-round cause.
At a glance
- Punjab recorded 5,114 farm fires in the 2025 season, down 53% from 2024 and 93% from 2021. Haryana recorded 662.63
- Crop fires gave an average of 4.9% of Delhi's PM2.5 between 15 October and 30 November 2025, down from 15.5% in 2024 (CREA).55 A CPCB reply to an RTI put the 2025 average at 3.5%.82
- Even so, Delhi's smog in December 2025, after the fires had ended, was more intense than in October and November.19
- Our 3-D air-path analysis: 71% of runs reaching Delhi on 1–10 November 2026 came from the north-west.1
Why farmers burn, and how the smoke reaches Delhi
After the rice harvest, farmers have only a few weeks to clear the straw and sow wheat. Burning is the fastest and cheapest way. The smoke rises and, when winds blow from the north-west, it drifts over Haryana into Delhi. On calm days it stays near the fields; on windy north-west days it can reach Delhi within a day.
What research says
Show the numbers
| Year | Average share |
|---|---|
| 2024 | 15.5% |
| 2025 | 4.9% |
- The share of crop fires in Delhi's PM2.5 changes sharply from day to day. Averages over the season are much lower than the peak days often quoted in the news.55
- Fires have fallen steeply. The government links the fall to state action plans, straw machines, use of straw outside the field, and stricter enforcement.63
- Fewer fires did not give Delhi clean air. The government itself calls stubble burning an episodic source, and CSE found that smog grew worse in December after the fires ended.19,62
What the satellites show
Show the numbers
| Year | Fires in India's Punjab |
|---|---|
| 2020 | 57,799 |
| 2021 | 45,443 |
| 2022 | 32,762 |
| 2023 | 19,171 |
| 2024 | 5,820 |
| 2025 | 3,077 |
| 2026 | 3,291 |
| Year (1 Oct – 10 Nov) | India Punjab | Haryana | Pakistan Punjab |
|---|---|---|---|
| 2020 | 57,799 | 4,312 | 6,860 |
| 2021 | 45,443 | 6,289 | 11,926 |
| 2022 | 32,762 | 3,216 | 6,233 |
| 2023 | 19,171 | 1,963 | 4,964 |
| 2024 | 5,820 | 1,243 | 8,150 |
| 2025 | 3,077 | 620 | 8,545 |
| 2026 | 3,291 | 396 | 7,420 |
Our own satellite count (VIIRS NOAA-20, same dates each year, duplicates merged) confirms a steep fall in India's Punjab: 57,799 fires in 2020 against 3,291 in 2026, a drop of 94%. Over the same dates, Pakistan's Punjab went from 6,860 to 7,420. Delhi's November air is still very poor, which supports research showing that crop fires are only one part of the problem.
4For 3–10 November 2026, NASA VIIRS detected 10,389 fires in the map area after removing double counts: 4,567 in Pakistan's Punjab, 3,040 in India's Punjab, 919 in Rajasthan, 701 in Uttar Pradesh and 323 in Haryana. The top districts were Sangrur (361), Ludhiana (353), Patiala (297), Firozpur (293) and Fazilka (224).1,4
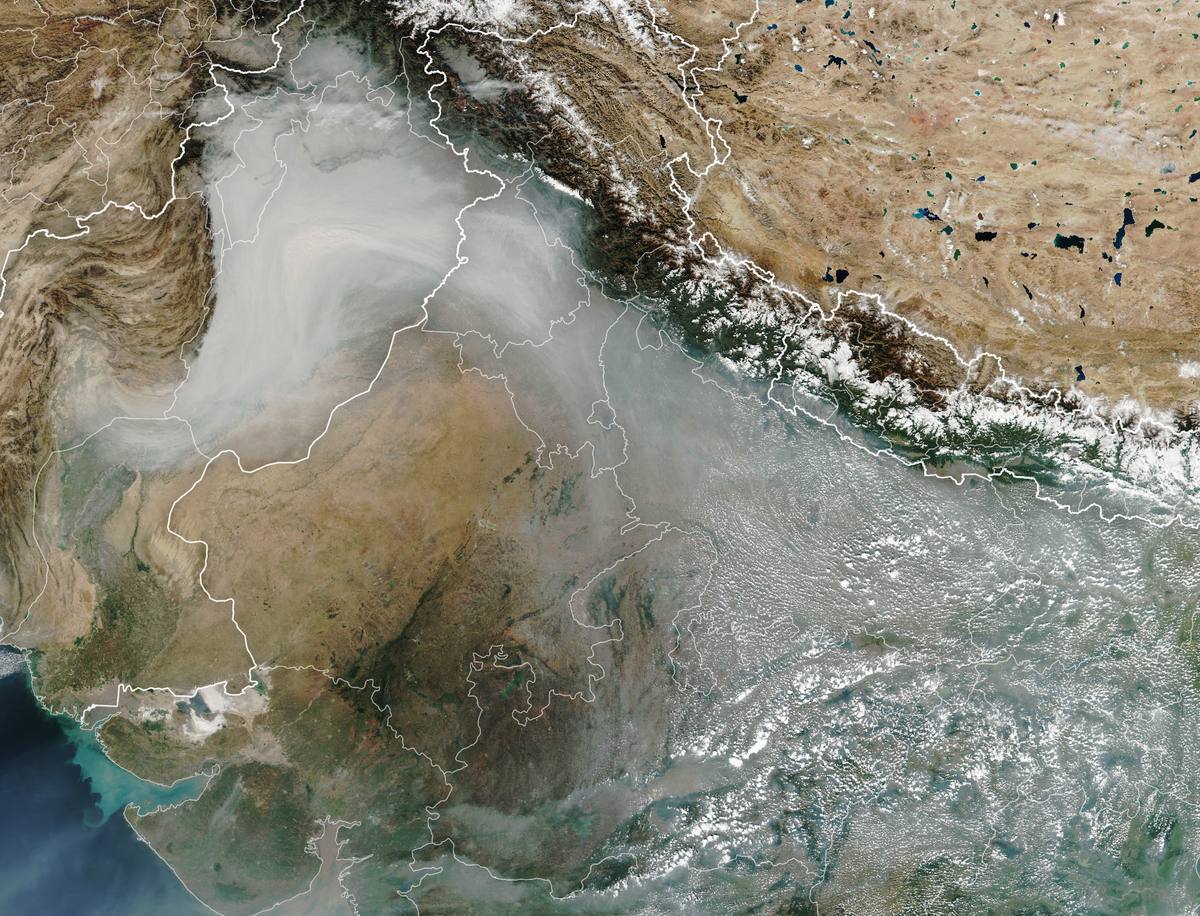
We traced Delhi's air 48 hours backwards in 3-D: 28 arrival times, three starting heights (100, 500 and 1,000 m) and five starting points, 420 runs in all. 71% of runs came from the north-west. The number of fires within 30 km of these air paths peaked on Diwali (2,180) and fell to 370 by 10 November.1,9
What is being done
Punjab and Haryana have received over ₹3,120 crore since 2018-19 for straw machines; more than 2.6 lakh machines went to farmers and over 33,800 to custom hiring centres.78 Power plants near Delhi must now burn pellets made partly from paddy straw.71 See Solutions for the evidence on each step.
Limits of this data
Satellites miss small fires and fires under cloud, and may miss fires lit when no satellite is overhead. Not every fire is stubble. Our trajectories use winds on eight pressure levels with vertical motion, but no turbulence; NOAA HYSPLIT is the reference model for research use.