Solutions to Delhi's air pollution: what works, what does not, and what to do next
A review of policies, field results and research for each of the 10 causes. Every claim links to its source on the Sources page.
Updated 12 November 2026 · About 15 minutes to read · Prepared by UGAC
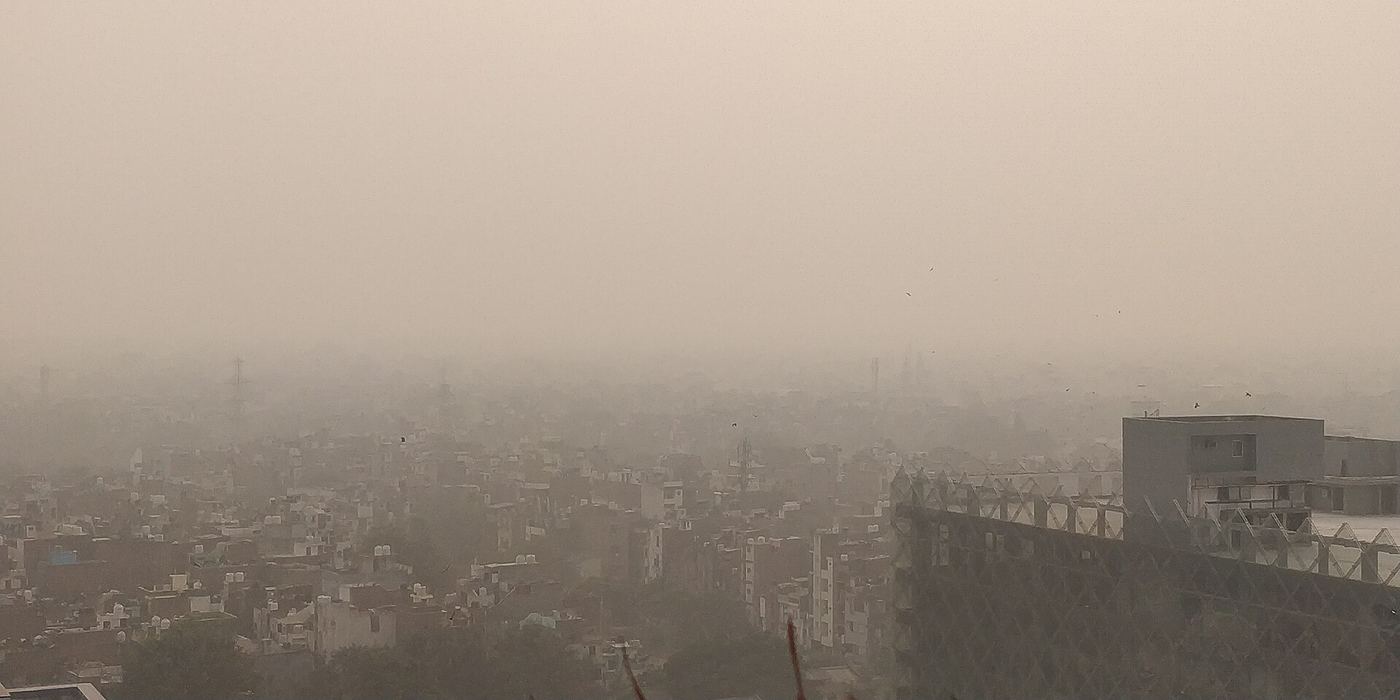
Delhi under thick smog in December 2019. Winter smog has returned every year despite many emergency steps. Photo: Prami.ap90, Wikimedia Commons, CC BY-SA 4.0.
Key findings
Progress is real but slow. Under the National Clean Air Programme (NCAP), Delhi's PM10 fell about 17% between 2017-18 and 2025-26, against a target of 40%.64 Its 2025 average PM10 was 197 µg/m³, nearly three times the national standard of 60.54
Cutting pollution at the source works best. Clean fuel for buses and industry, cleaner brick kilns and fewer crop fires have the strongest record.18,56,63
Quick fixes that try to clean dirty air show little effect. Smog towers help only within about 200 m, a cloud-seeding trial gave no rain in Delhi, and odd-even showed little or no measurable PM2.5 benefit.23,42,81
Some rules have been weakened. In July 2025, sulphur-control (FGD) rules for coal power plants were relaxed, and most plants were exempted.58
Delhi cannot fix this alone. Much of its PM2.5 comes from outside the city. The World Bank finds that a plan shared across the whole Indo-Gangetic Plain is the most cost-effective path.35
1. Where Delhi stands
India's National Clean Air Programme set cities a goal of cutting particle pollution by 40% by 2025-26, compared with 2017-18. Delhi achieved about 17%.64 In calendar year 2025 its average PM10 was 197 µg/m³, the highest of any Indian city in that analysis.54 Money was not the only limit: Delhi used less than 40% of the NCAP funds given to it in the first five years.43
Delhi's PM10 cut under the National Clean Air Programme
Target by 2025-2640%
Achieved by 2025-2617%
Delhi reached less than half of its target. Source: CREA analysis reported by Down To Earth 64Show the numbers
PM10 reduction
Target
40%
Achieved
17%
For bad days, Delhi-NCR uses the Graded Response Action Plan (GRAP). Since the 2024 revision, GRAP has four stages linked to the AQI (Poor 201–300, Very Poor 301–400, Severe 401–450, Severe+ above 450). Stages II to IV can now start up to three days early, based on the IMD/IITM air quality forecast, instead of waiting for the air to turn bad.32 In November 2025 several steps were moved to lower stages so that they start sooner.66
What this means: emergency steps can stop a bad week from turning into a severe one, but they cannot lower the yearly average. That needs steady cuts in emissions all year, across the whole region.
2. Evidence scorecard: what has worked so far
We graded each measure by what published studies and official data show, not by what was announced. Worked means a clear, measured fall. Partial means some gain or mixed results. Little or no effect means studies found almost no benefit.
Measure
What the evidence shows
Verdict
CNG for buses and autos (2001–02, Supreme Court order)
Studies of 2000–2005 data found lower particles, carbon monoxide and SO₂. The gain came from CNG together with cleaner fuels and vehicles, not CNG alone.18
Worked
Coal ban for industry in NCR (fully in force from 1 Jan 2023)
Only approved fuels such as gas and electricity are allowed. Industries say gas costs more and some still wait for gas connections.51,56
Working
Crop-residue machines and stricter enforcement
Punjab recorded 5,114 farm fires in 2025, down 93% from 2021.63 Delhi's November air was still very poor.62
Fires down
Cleaner (zigzag) brick kilns
A 2026 comparison of stack emissions found zigzag kilns gave the largest cuts, especially when part of the coal was replaced with farm residue.29
Worked
Electric buses
5,238 of Delhi's buses are electric (October 2026).75 No study has yet measured the effect on air quality.
Promising
Truck bypass expressways
About 16,900 heavy trucks still enter Delhi daily and make up 23% of transport emissions.59
Partial
Pusa bio-decomposer for straw
Results depend on mixing with soil and irrigation. A PAU study found decomposers did not stop burning. CEEW calls for proper field testing.41,70
Mixed
Odd-even car rationing (2016, 2019)
A peer-reviewed study found no measurable PM2.5 benefit. A DTU study found a 4.7–5.7% fall in the first phase.23,76
Little effect
Smog towers
Delhi's pollution control committee told the NGT the effect reaches only about 200 m, and that at least 40,000 towers would be needed for a 17% cut.81
Little effect
Cloud seeding (October 2025)
No rain fell in the seeded parts of Delhi. 0.1 mm fell in Noida and 0.2 mm in Greater Noida. Clouds were too dry.42,79
Failed
Sulphur controls (FGD) at coal plants
In July 2025, only plants near big cities (Category A) still have to fit FGD by December 2027. Others were exempted or left to case-by-case review.58,84
Weakened
Water sprinklers and anti-smog guns are widely used, but we did not find any published citywide evaluation of their effect.
3. Solutions for each cause
For each cause, this section sets out what has been done, the gap that remains, and our recommended next step. Recommendations are UGAC's view, based on the evidence above.
Done so far. CNG buses and autos since 2001–02.18 Electric buses now make up about three in four city buses.75 EVs were 12.7% of new vehicles registered in Delhi in 2025-26.60
Delhi's public bus fleet, October 2026
Electric: 5,238 (75%)CNG: 1,750 (25%)
About three in four city buses are now electric. Source: Asia News Network 75Show the numbers
Bus type
Number
Electric
5,238
CNG
1,750
Total
6,988
The gap. Freight is the weak spot: about 16,900 heavy trucks entering daily give 23% of transport emissions.59 Much of the EV growth comes from e-rickshaws, which made up about 42% of EV registrations in 2025.61
Next step. Move delivery vans, light trucks and city logistics to electric first. Bring more buses so people leave cars at home. Add parking charges and a low-emission zone for the oldest diesel vehicles.
Why it matters. Particles formed in the air from gases such as SO₂, NOx and ammonia make up a large share of PM2.5 in north India.33 Ammonia comes mostly from fertiliser, and urea is the largest source. India has no rules for farm ammonia comparable to those for other pollutants.17 One estimate puts the fertiliser ammonia contribution at about 3.5–6 µg/m³ of yearly PM2.5 in the region.31
Next step. Treat SO₂, NOx and ammonia together across the region: keep sulphur controls on coal plants, cut NOx from vehicles and industry, and promote efficient fertiliser use. Our own map shows that much of Delhi's PM2.5 level is already present 100–300 km away (see cause 02).
Done so far. Every construction site of 500 m² or more in Delhi must register on the DPCC dust portal, file a self-audit every 15 days, and install PM sensors and video monitoring. Large sites must run anti-smog guns.22 For winter 2025-26 the city listed 86 mechanical road sweepers and 362 anti-smog guns.88
The gap. No public study shows how much these steps lower dust across the city.
Next step. Pave or green the unpaved road edges that create dust, sweep with vacuum machines on a fixed route, recycle construction waste, and publish the portal's compliance data so results can be checked.
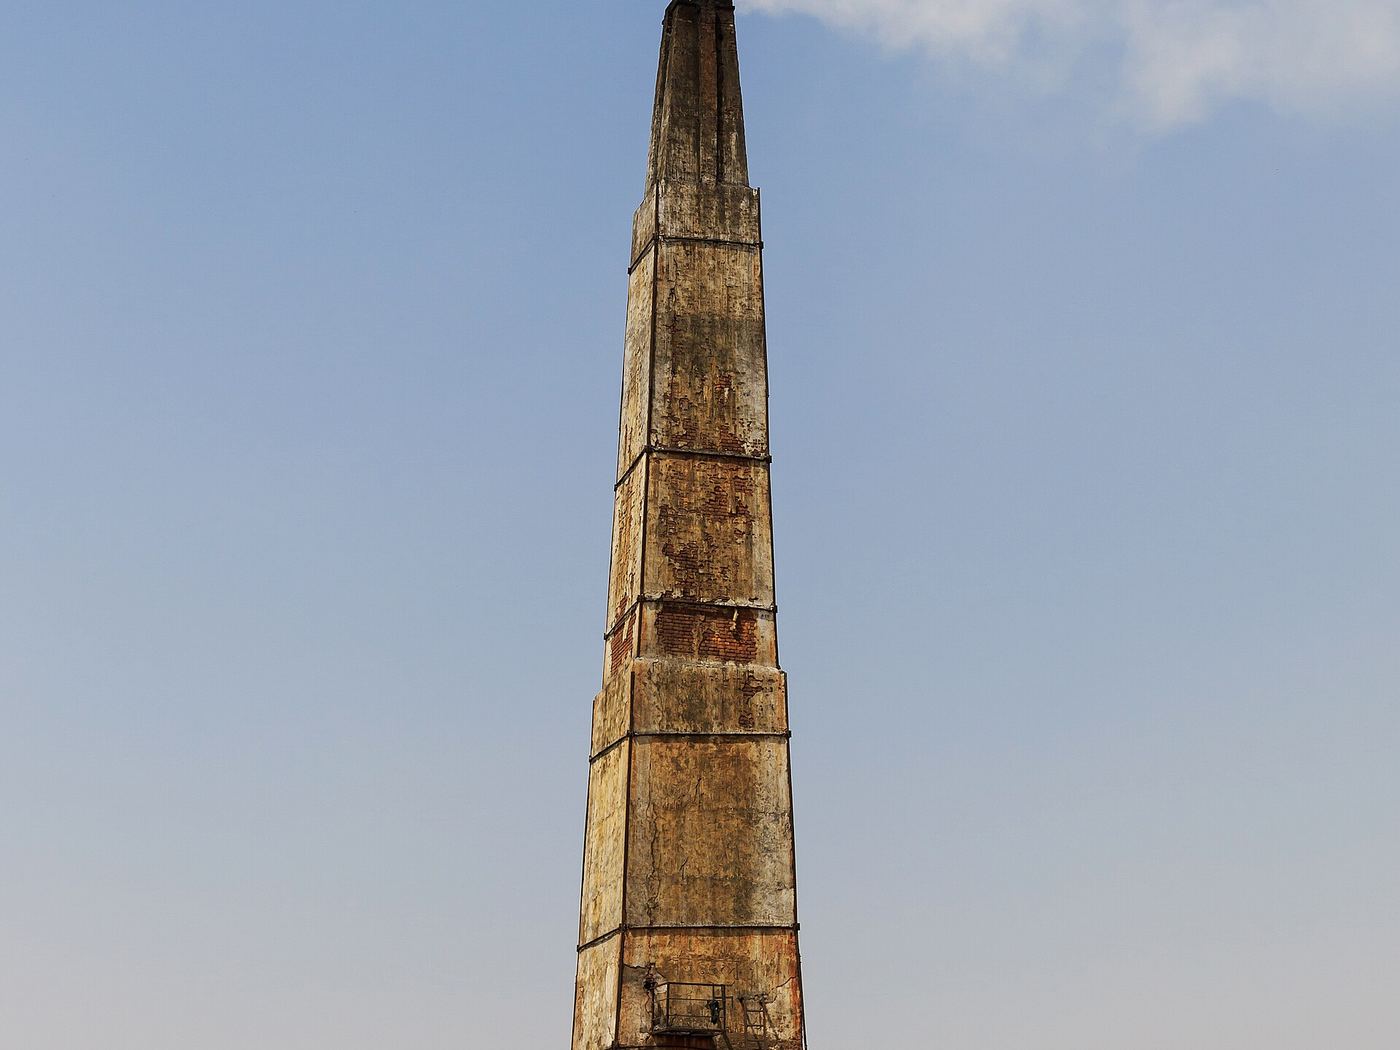
A brick kiln chimney in Bharatpur district, Rajasthan, with a heap of rice husk used as fuel. Kilns like this ring the NCR. Photo: A.Savin, Wikimedia Commons, FAL.
Done so far. Coal and other unapproved fuels have been banned for industry across NCR since 1 January 2023.56 Zigzag kilns burn fuel more completely and release less smoke than the older fixed-chimney design.29
The gap. Gas costs more than coal, and some units waited long for a gas connection.51,56
Next step. Make gas affordable for small units (for example through shared boilers in industrial clusters), finish moving all kilns in the region to zigzag or better, and check kilns from satellite images each season.
Done so far. From 2025-26 every coal plant must co-fire 5% biomass pellets. Plants in and around NCR must go further, and at least half of their pellets must be made from paddy straw from the region.71 CAQM has served notices on six plants within 300 km of Delhi for missing these targets.48
The gap. The July 2025 change means most plants no longer need FGD to remove SO₂. Category A plants must comply by December 2027, Category B only if an expert committee directs, and Category C is exempt.58 Our satellite analysis found NO₂ plumes over 16 of the 18 coal plants within 320 km of Delhi (see cause 05).
Next step. Require FGD and NOx controls at every plant within 300 km of Delhi, and publish each plant's continuous emission data online.
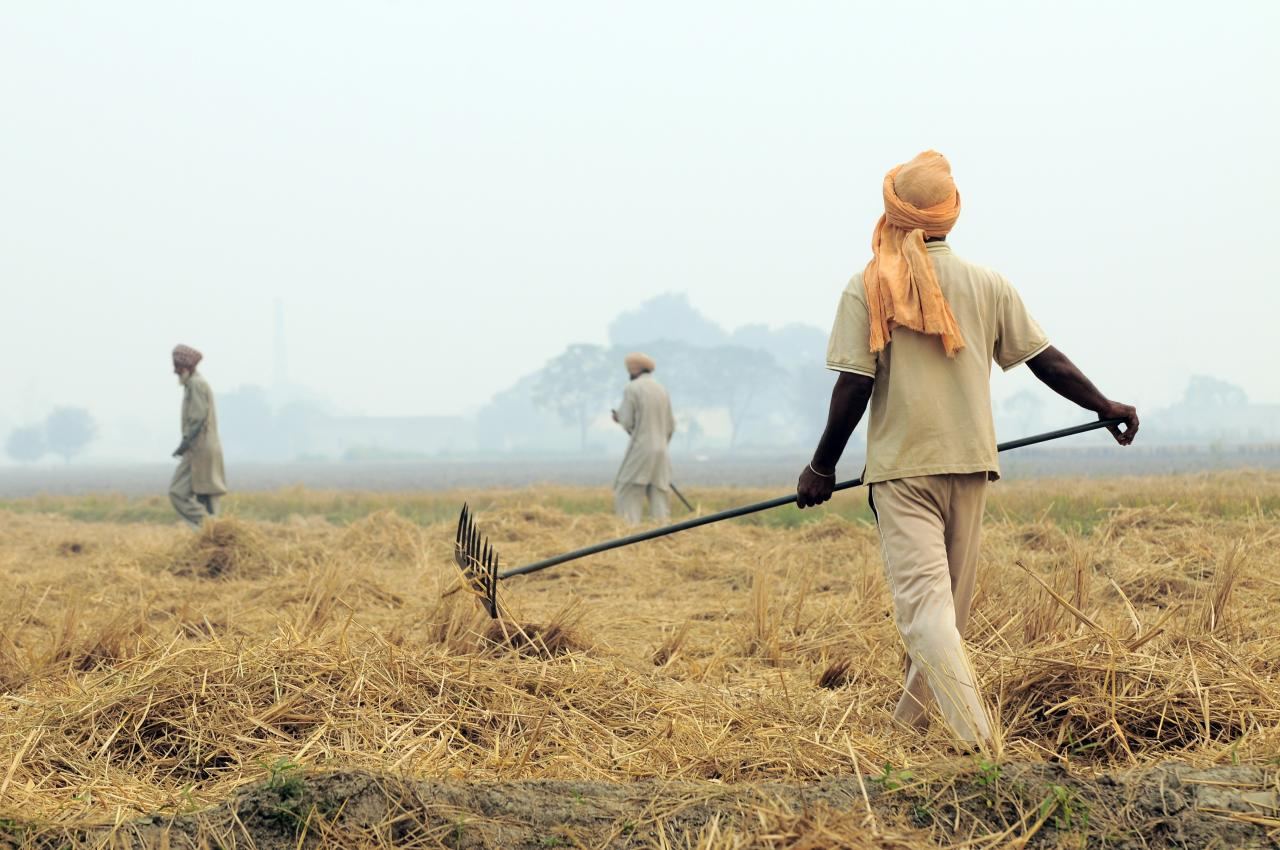
Farm workers prepare harvested rice fields in south-east Punjab, where straw is often burned before sowing wheat. Photo: CIAT, Wikimedia Commons, CC BY-SA 2.0.
Done so far. Punjab and Haryana have received over ₹3,120 crore since 2018-19 for straw machines. More than 2.6 lakh machines went to farmers and over 33,800 to custom hiring centres.78 Punjab's fire count in 2025 was 5,114, down 53% from 2024 and 93% from 2021. Haryana recorded 662.63
Satellite fire detections in India's Punjab, 1 Oct – 10 Nov each year
020,00040,00060,000
57,799
2020
2021
2022
2023
2024
2025
3,291
2026
Fires fell by 94% between 2020 and 2026. Our own count of VIIRS (NOAA-20) detections, same dates each year, duplicates merged. Source: NASA FIRMS, analysed by UGAC 1Show the numbers
Year
Fires in India's Punjab
2020
57,799
2021
45,443
2022
32,762
2023
19,171
2024
5,820
2025
3,077
2026
3,291
The gap. Fewer fires did not give Delhi clean air in November. The government itself calls stubble burning an episodic source.62 The bio-decomposer has mixed field results.41,70
Next step. Keep paying for straw collection and use it in power plants and kilns, which also supports the co-firing rule. Report fire counts from several satellites, since some burning may happen when satellites are not overhead.
Done so far. The Ujjwala scheme (PMUY) has given about 10.35 crore LPG connections. Refills per connection have risen from about 3 a year in 2019-20.68,77
LPG refills per Ujjwala connection per year
0246
3.0
2019-20
4.0
2023-24
4.4
2024-25
4.7
2025-26
Use is rising, but the average is still under five cylinders a year, so many homes also keep using wood or dung. Source: Government data reported by Free Press Journal and Kashmir Life 68,77Show the numbers
Year
Refills per connection
2019-20
3.01
2023-24
3.95
2024-25
4.43
2025-26
4.71
The gap. A connection is not daily use. Our map shows about 1 crore people around Delhi still without clean cooking fuel (see cause 07).
Next step. Give extra refill support in the districts nearest Delhi with the lowest clean-fuel use, especially in winter when evening smoke is trapped.
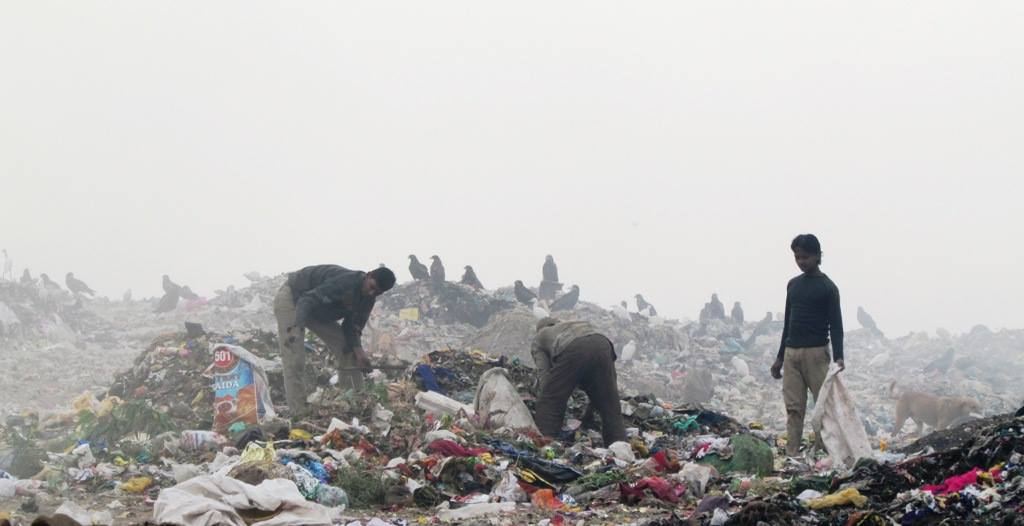
Workers on top of the Ghazipur landfill in 2013. Fires on these mounds add smoke to east Delhi's air. Photo: FacetsOfNonStickPans, Wikimedia Commons, CC BY-SA 4.0.
Done so far. A record 74.11 lakh tonnes of old waste was processed at the three landfills between April 2025 and February 2026.87
Legacy waste still at Delhi's three landfills, February 2026 (lakh tonnes)
Ghazipur68.6
Bhalswa30.2
Okhla16.4
About 115 lakh tonnes remained, even after a record 74 lakh tonnes was processed in one year. Source: ThePrint, citing the Delhi Economic Survey 87Show the numbers
Landfill
Lakh tonnes left
Ghazipur
68.60
Bhalswa
30.18
Okhla
16.40
The gap. About 115 lakh tonnes still remained in February 2026.87 The Bhalswa deadline has been pushed back for the sixth time, now to February 2027.45
Next step. Stop fresh waste reaching the mounds by sorting waste at source, and watch the landfills for fires in winter.
Done so far. In October 2025 the Supreme Court relaxed the full ban in NCR. Certified green crackers could be sold from 18 to 20 October and burst only from 6 to 7 am and 8 to 10 pm on the day before Diwali and on Diwali.83
The gap. Our monitor data shows PM2.5 rose on Diwali night at most monitors compared with ordinary nights that week (see cause 09).
Next step. Encourage community fireworks shows instead of street bursting, enforce the time limits, and publish monitor data for Diwali night every year.
Done so far. GRAP steps are now triggered by forecasts, up to three days ahead.32
Next step. Use the low-wind, low-mixing forecast to cut emissions before a bad spell begins, and plan winter rules (trucks, construction, waste fires) for the whole October to February season instead of day by day.
4. One airshed, one plan
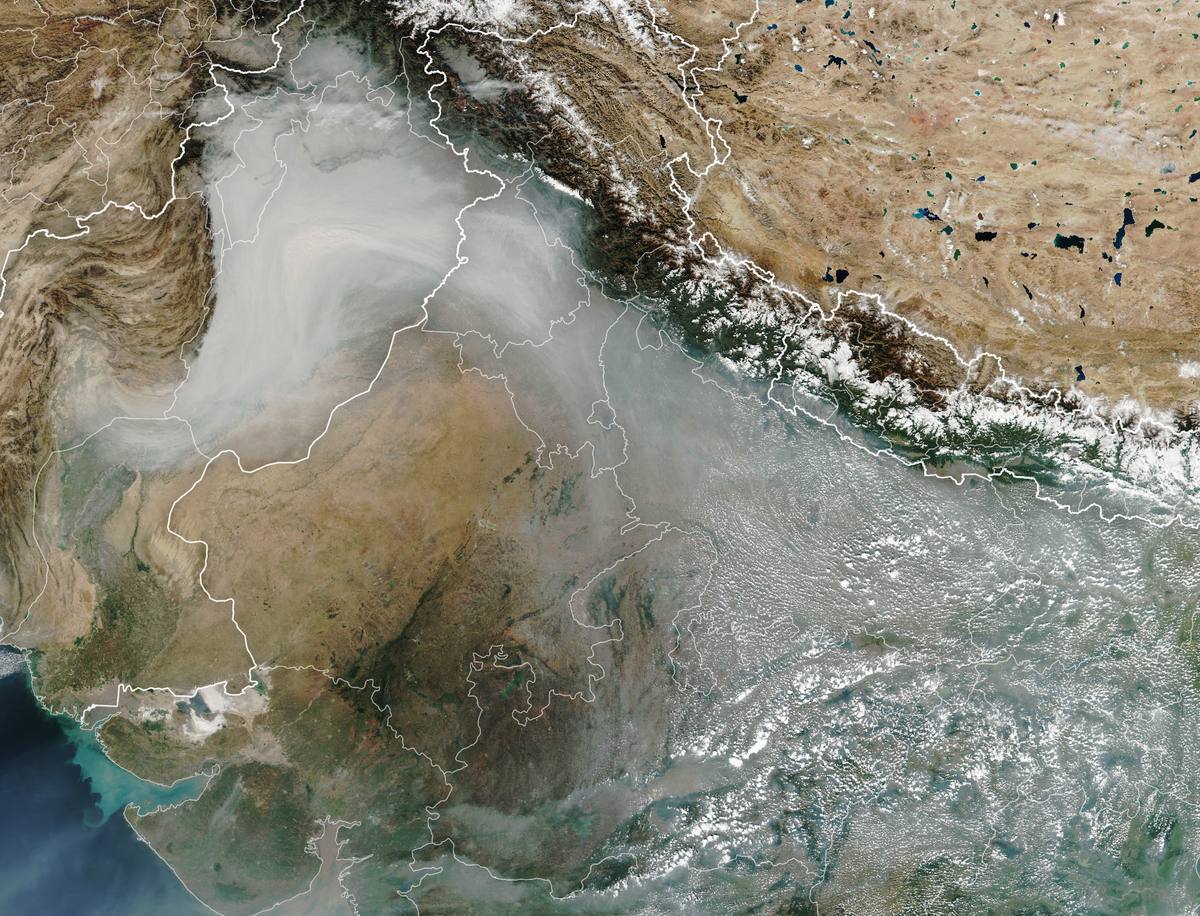
Smoke and haze over Pakistan and northern India in November 2024, seen by NASA satellites. The haze covers the whole plain, not just Delhi. Photo: NASA Earth Observatory images by Wanmei Liang, using VIIRS data from NASA EOSDIS LANCE, GIBS/Worldview, and the Suomi Na, Wikimedia Commons, Public domain.
Air does not stop at state borders. The World Bank identifies the Indo-Gangetic Plain as one shared airshed covering India, Pakistan, Bangladesh and Nepal. Its modelling finds that coordinated action across the whole airshed is far cheaper per unit of clean air than each city acting alone.35 The same report finds that measures focused only on power plants, large factories and transport will be only partly successful, even if fully carried out.35
What this means for Delhi: a Delhi-only plan cannot reach safe air. Clean-air funding and rules need to cover the NCR districts, Punjab, Haryana and western Uttar Pradesh together. CAQM already covers the NCR and adjoining areas, which makes it the natural body to lead such a plan.
5. Lessons from Beijing
Beijing's yearly PM2.5 fell from 89.5 µg/m³ in 2013 to 58.0 µg/m³ in 2017. A model study found that controls on emissions explain about 80% of the fall, with weather explaining the rest.27
Beijing's annual PM2.5, before and after its 2013 action plan (µg/m³)
050100
89.5
2013
58.0
2017
A fall of about 35% in five years. A model study credits about 80% of the fall to emission controls, not weather. Source: Atmospheric Chemistry and Physics 27Show the numbers
Year
PM2.5 (µg/m³)
2013
89.5
2017
58.0
The study credits local steps such as controlling coal boilers, moving homes to clean fuels and restructuring industry.27 Delhi has started on several of these (the coal ban for industry, clean buses, regional bodies). What it lacks is the same speed and enforcement, applied across the whole region.
6. Priority actions
Action
Who
Time
Evidence
One regional clean-air plan with shared targets for NCR, Punjab, Haryana and western UP
Check the forecast, not only today's AQI. GRAP and the IMD/IITM forecast give up to three days' warning.32 Plan outdoor exercise for cleaner hours and days.
Clean the air where you sleep. In a study in a north Indian old-age home, an air purifier lowered indoor PM2.5 from about 440 to about 131 µg/m³ and lowered systolic blood pressure. It still did not make the air fully safe.25
Follow the health advisory. The Health Ministry's advisory explains steps for children, older people and those with heart or lung disease.24
Do not burn waste or leaves, and report open burning to your local body.
Choose the metro, bus or an EV where you can, and keep your vehicle's pollution check up to date.